Friction-Aware MPC with Lateral-Slip Constraint Back-Off
Simulation-based research on friction-aware linear MPC for vehicle path following and stability under reduced tire-force capacity, parameter mismatch, and high-speed stress testing.
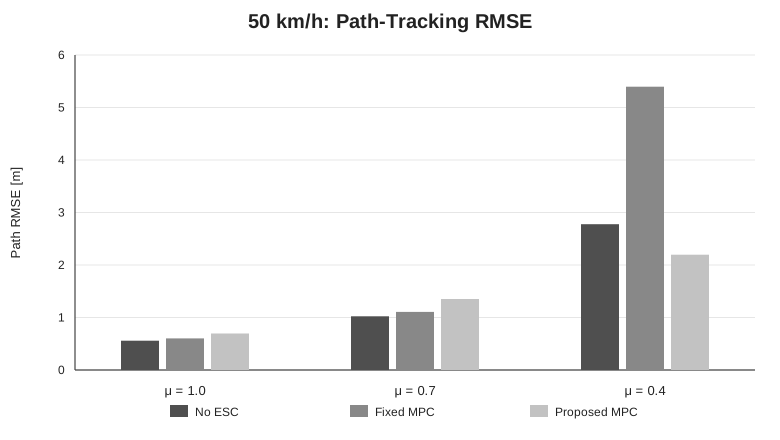
This research project develops and evaluates a friction-aware linear Model Predictive Controller (MPC) for vehicle path following and stability under reduced tire-force capacity. The controller is evaluated against a nonlinear five-state combined-slip vehicle model and compared with both a fixed nominal MPC and a no-ESC baseline.
The reproducible MATLAB/Simulink research code and frozen numerical results are available here: GitHub repository
Manuscript status: the journal-neutral master manuscript is complete and the scientific results are frozen. Remaining pre-submission work is limited to author metadata/confirmations and target-journal formatting.
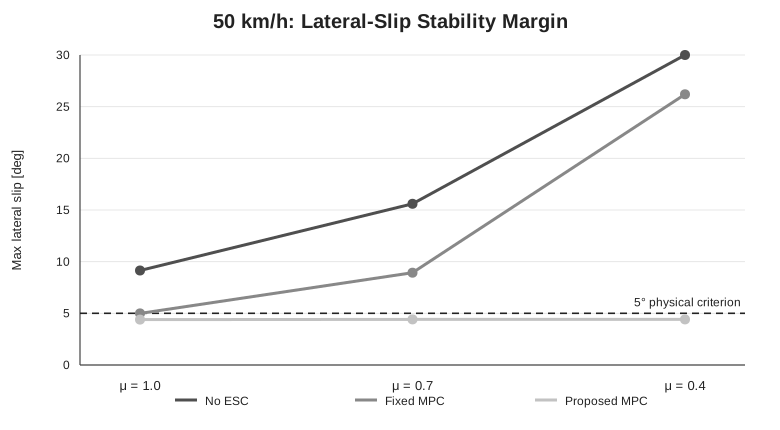
The final controller uses a 4.4° internal lateral-slip back-off while performance is evaluated against a separate physical lateral-slip criterion of 5°. The prediction-model tire-force-capacity factor is matched to the simulated road/plant capacity for the tested scenarios. This project does not claim online friction estimation, nonlinear MPC, formal robust MPC, or friction-dependent constraint scheduling.
Research question
A fixed nominal MPC can track well when the tire-force capacity is high, yet lose stability margin when the available force capacity is reduced. The central question is whether a capacity-aware prediction model combined with a modest constraint back-off can preserve lateral-slip and sideslip margins without abandoning path-following performance.
Final controller configuration
| Setting | Final value |
|---|---|
| Main operating speed | 50 km/h |
| Sampling period | 0.01 s |
| Prediction horizon | 20 |
| Control horizon | 5 |
| Manipulated variables | Steering, front-wheel torque, rear-wheel torque |
| MPC internal lateral-slip bound | ±4.4° |
| Physical lateral-slip evaluation criterion | ±5° |
| Longitudinal-slip criterion | ±0.1 |
| Vehicle-sideslip criterion | ±0.1 rad |
| Tested tire-force-capacity factors | μ = 1.0, 0.7, 0.4 |
For the tested capacity levels, the prediction-model factor is set as mu_MPC = mu_road. This is a controlled simulation assumption using known scenario capacity, not an online road-friction estimator.
50 km/h tracking comparison
| μ | Controller | Path RMSE | Max path error | Max lateral slip | Max β | All monitored criteria |
|---|---|---|---|---|---|---|
| 1.0 | Fixed MPC | 0.603 m | 1.780 m | 4.990° | 0.0399 rad | Pass |
| 1.0 | Proposed MPC | 0.695 m | 2.101 m | 4.394° | 0.0367 rad | Pass |
| 0.7 | Fixed MPC | 1.107 m | 3.084 m | 8.936° | 0.1098 rad | Fail |
| 0.7 | Proposed MPC | 1.352 m | 3.408 m | 4.416° | 0.0494 rad | Pass |
| 0.4 | Fixed MPC | 5.396 m | 16.719 m | 26.199° | 0.4305 rad | Fail |
| 0.4 | Proposed MPC | 2.196 m | 3.806 m | 4.416° | 0.0635 rad | Pass |
The result also exposes an important tradeoff: at μ = 1.0 and μ = 0.7, the proposed controller does not minimize path RMSE. Its design deliberately gives up some nominal tracking performance to retain stability margin as available tire-force capacity decreases.
Stability under reduced tire-force capacity
Plant-parameter mismatch
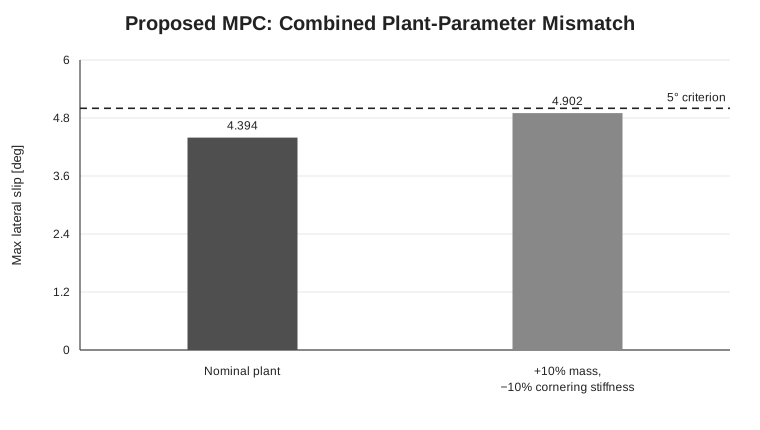
Robustness is tested by changing the nonlinear plant only: vehicle mass is increased by 10% and front/rear cornering stiffness is reduced by 10%, while the MPC prediction model remains nominal.
| Mismatch metric | Result |
|---|---|
| Path RMSE | 0.900 m |
| Maximum path error | 2.653 m |
| Maximum lateral slip | 4.902° |
| Maximum longitudinal slip | 0.00697 |
| Maximum vehicle sideslip β | 0.0416 rad |
The 4.902° peak lateral slip is close to the 5° physical evaluation limit, so this should be interpreted as a successful tested robustness case, not as a formal robust-stability guarantee.
80.5 km/h stress test
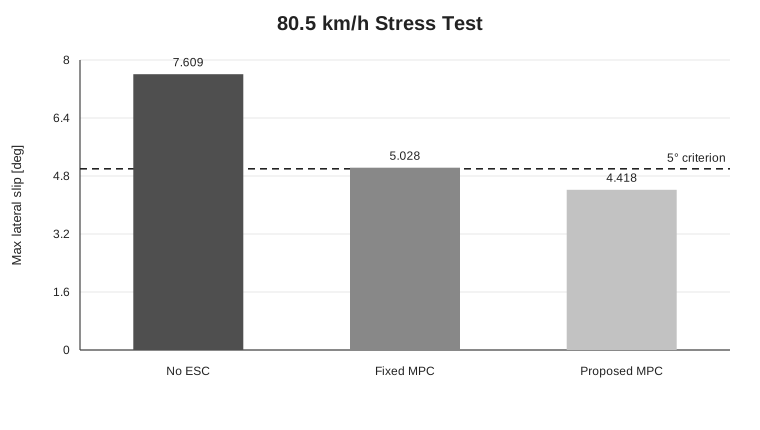
A second scenario increases the vehicle speed to 80.5 km/h at μ = 1.0. This is a simulation stress test using the same path-following architecture; it is not presented as an FMVSS 126 compliance maneuver.
| Controller | Path RMSE | Max lateral slip | Max β | All monitored criteria |
|---|---|---|---|---|
| No ESC | 0.932 m | 7.609° | 0.1104 rad | Fail |
| Fixed MPC | 0.898 m | 5.028° | 0.0642 rad | Fail |
| Proposed MPC | 0.952 m | 4.418° | 0.0565 rad | Pass |
Computational timing
| Timing metric | Result |
|---|---|
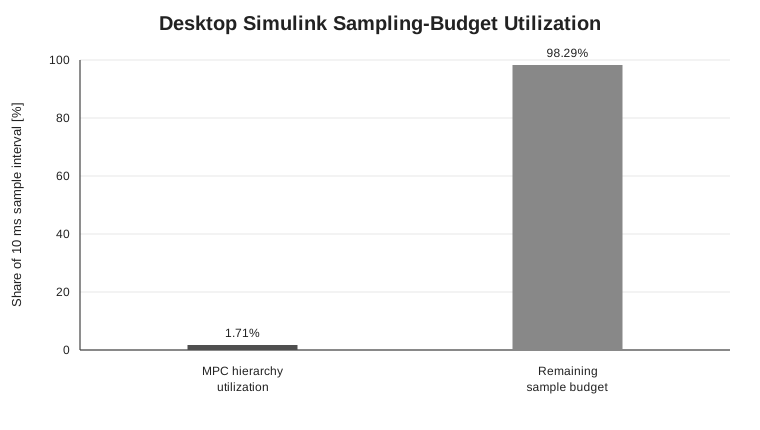
| Mean MPC hierarchy time per sample | 0.171 ms |
| Standard deviation | 0.00476 ms |
| Maximum run-average time | 0.176 ms |
| Mean sampling utilization | 1.71% |
| Mean timing margin | 9.829 ms |
| Sampling interval | 10 ms |
Control effort
| Metric | Fixed MPC | Proposed MPC |
|---|---|---|
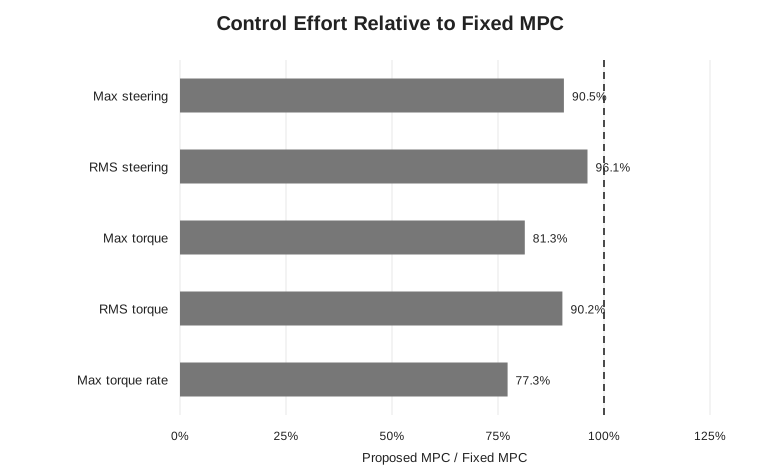
| Maximum steering | 8.646° | 7.828° |
| RMS steering | 3.903° | 3.751° |
| Maximum steering rate | 409.852°/s | 410.587°/s |
| Maximum wheel torque | 83.331 N·m | 67.761 N·m |
| RMS wheel torque | 36.584 N·m | 32.997 N·m |
| Maximum torque rate | 114.894 N·m/s | 88.783 N·m/s |
Relative to the fixed MPC, the proposed controller reduces maximum steering magnitude by about 9.5%, maximum wheel torque by 18.7%, and maximum torque rate by 22.7%. Peak steering rate increases slightly, by about 0.18%, so no claim of improved peak steering-rate smoothness is made.
Reproducibility
The frozen study package was validated in MATLAB R2022b Update 4 with Simulink, Model Predictive Control Toolbox, Control System Toolbox, and Symbolic Math Toolbox. The repository contains the final Simulink model, path data, proposed/fixed/no-ESC scenario scripts, robustness and high-speed tests, corrected timing/control-effort scripts, frozen CSV tables, and publication-figure generator.
The numerical source of truth is the frozen result tables and verified-results file included with the research-code package. Older exploratory 4.7°, 4.9°, 5°, and 6° tuning experiments are intentionally excluded from the public-facing project.
Scope and limitations
The controller is evaluated entirely in simulation. The project does not provide experimental vehicle validation, hardware-in-the-loop validation, embedded timing certification, formal robust-stability guarantees, online friction estimation, nonlinear MPC, stochastic/tube MPC, or regulatory compliance testing. The 80.5 km/h scenario is a stress test, and the parameter-mismatch study is an empirical robustness evaluation.
The research manuscript package identifies the manuscript authors as Mohammad-Hossein Fakouri and Mohsen Ghaffari. The website page reports only technical results supported by the frozen pre-submission package and does not infer unconfirmed contribution roles.